Home / Product Setup & Usage / Reporting
Forecast Completion
Once your migration has begun, you may view the Forecast page to see the estimated time of completion. On the left side navigation pane, click Reporting / Forecast.
The left side of the graph shows the percentage completed, starting at zero in the top corner and going down to one hundred. The bottom of the graph shows the day and time.
The forecast takes the actual data rates experienced (throughput rate) and calculates the amount of data migrated with remaining data to estimate the completion time.
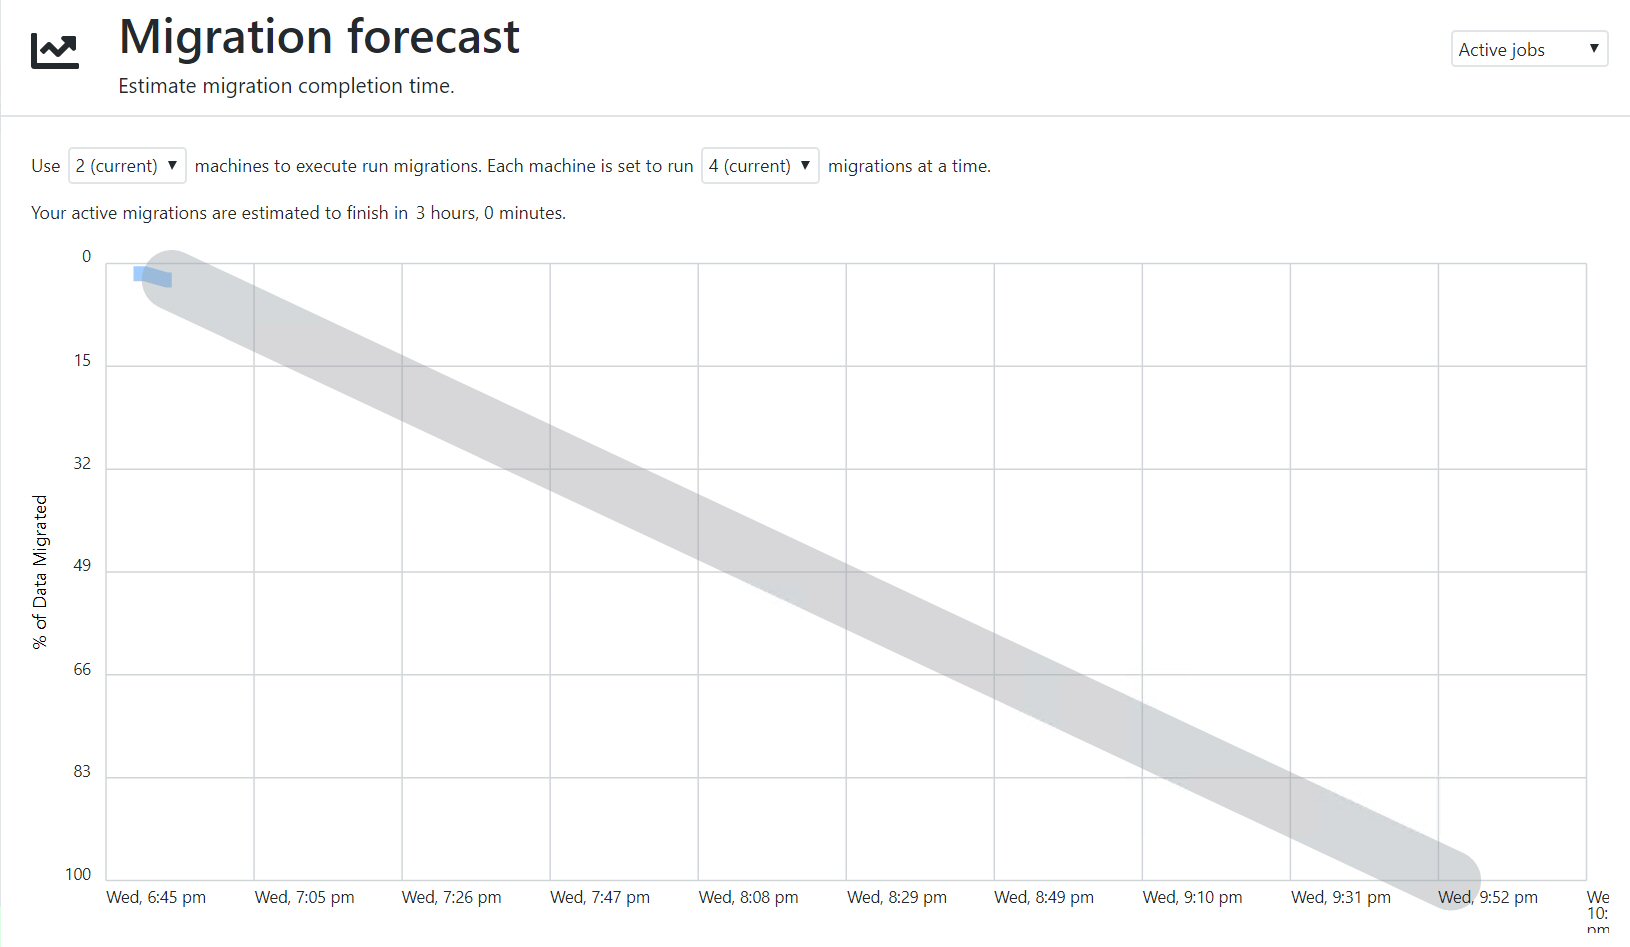
Click the drop-down list in the top right corner to view different migration jobs, both active and completed, as well as all active migration jobs aggregated together.
Adjust Projected Timeline
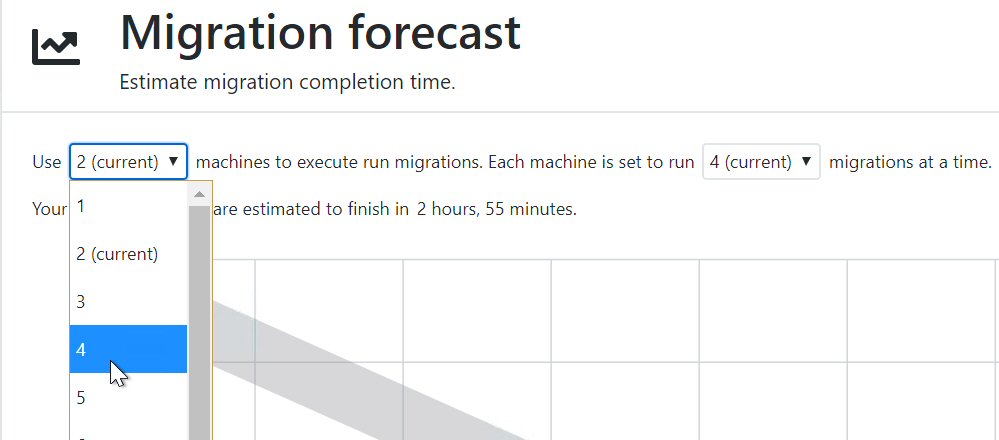
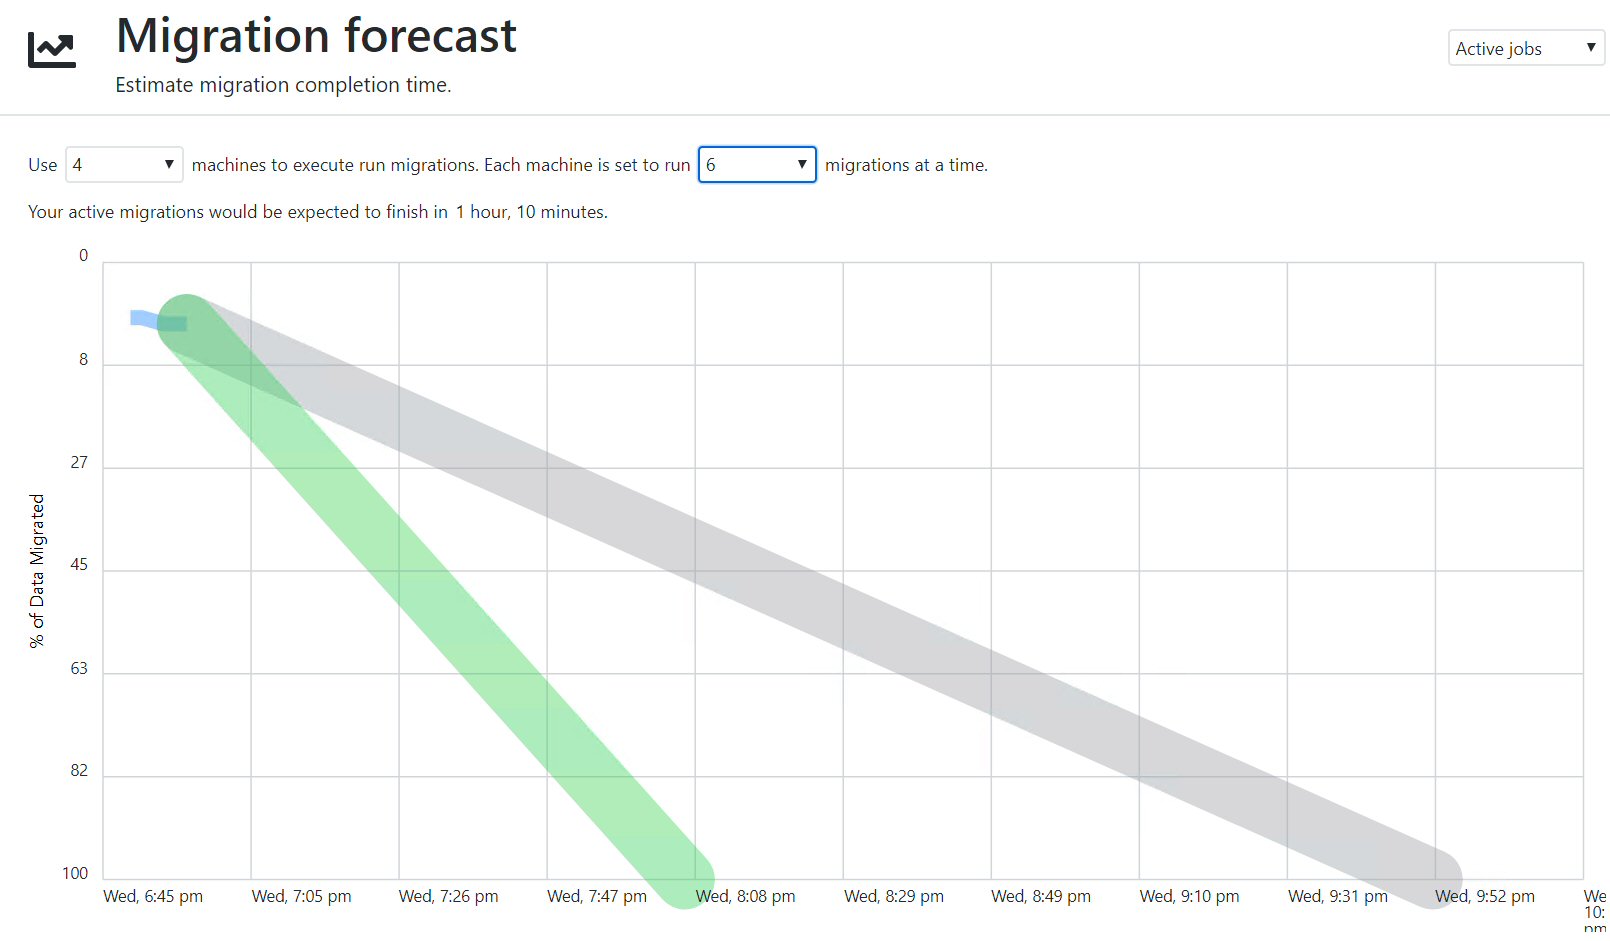
You may also project the estimated migration timeline when adjusting scaling resources. For example, you can identify the forecasted completion if you added more Remote Agent Machines or increased the number of concurrent migrations.
Adjust the number of Remote Machines
Adjust Concurrency
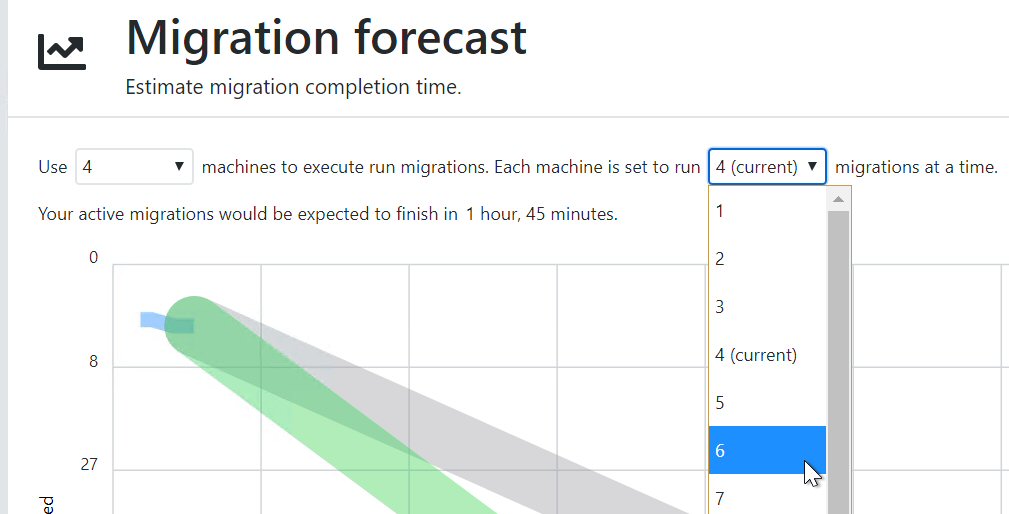
After adding more Remote Machines and increasing concurrency per machine, notice that the estimated completion time is adjusted and projected to complete more quickly.
Note
This is only a projection, and any changes you make to migration resources on this page are only adjusting projected estimates, and not actual migration behavior.